Researchers/Students/Public administration
Searching for statistical data – training course
Aim of the training course: To gain a basic understanding of the functionality and principles of using public statistics information resources, data sources and the principles of statistical data collection. To acquire the skills to independently search for data and generate reports at various levels of detail.
Topics covered in the training course:
1.Basic information on public statistics databases available on the Central Statistical Office’s information portals:
- Local Data Bank;
- STRATEG;
- Poland Data Bank;
- Macroeconomic Data Bank;
- Sectoral Knowledge Bases;
- Atlas of Regions;
- Demography Database;
- Geostatistical Portal.
2. Contents of the systems:
- sources of statistical data;
- rules governing the provision of statistical data;
- data access paths;
- subject matter, territorial and temporal scope of the data;
- system functionalities.
3. Data visualisation:
- a. statistical tables;
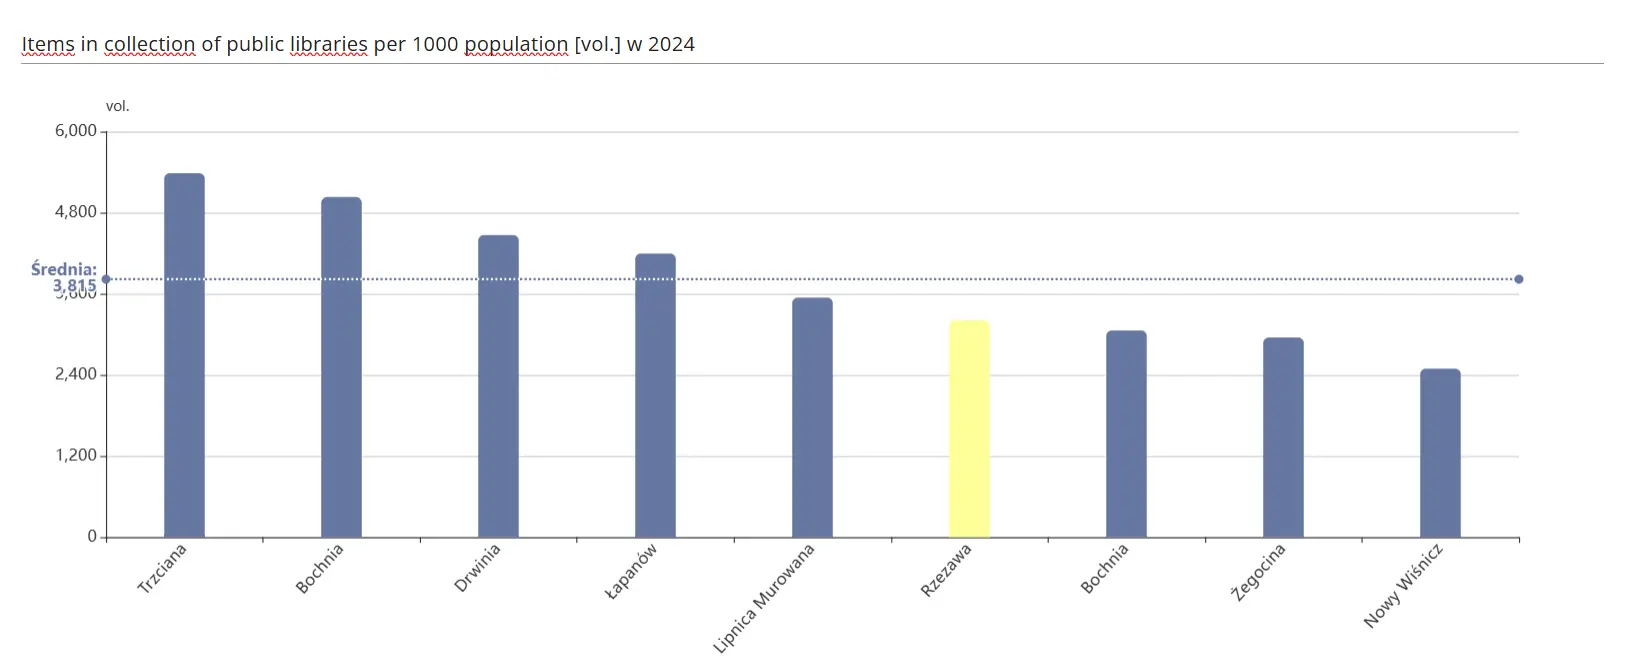
- b. charts;
- c. maps;
- d. reports;
- e. metadata and analyses.
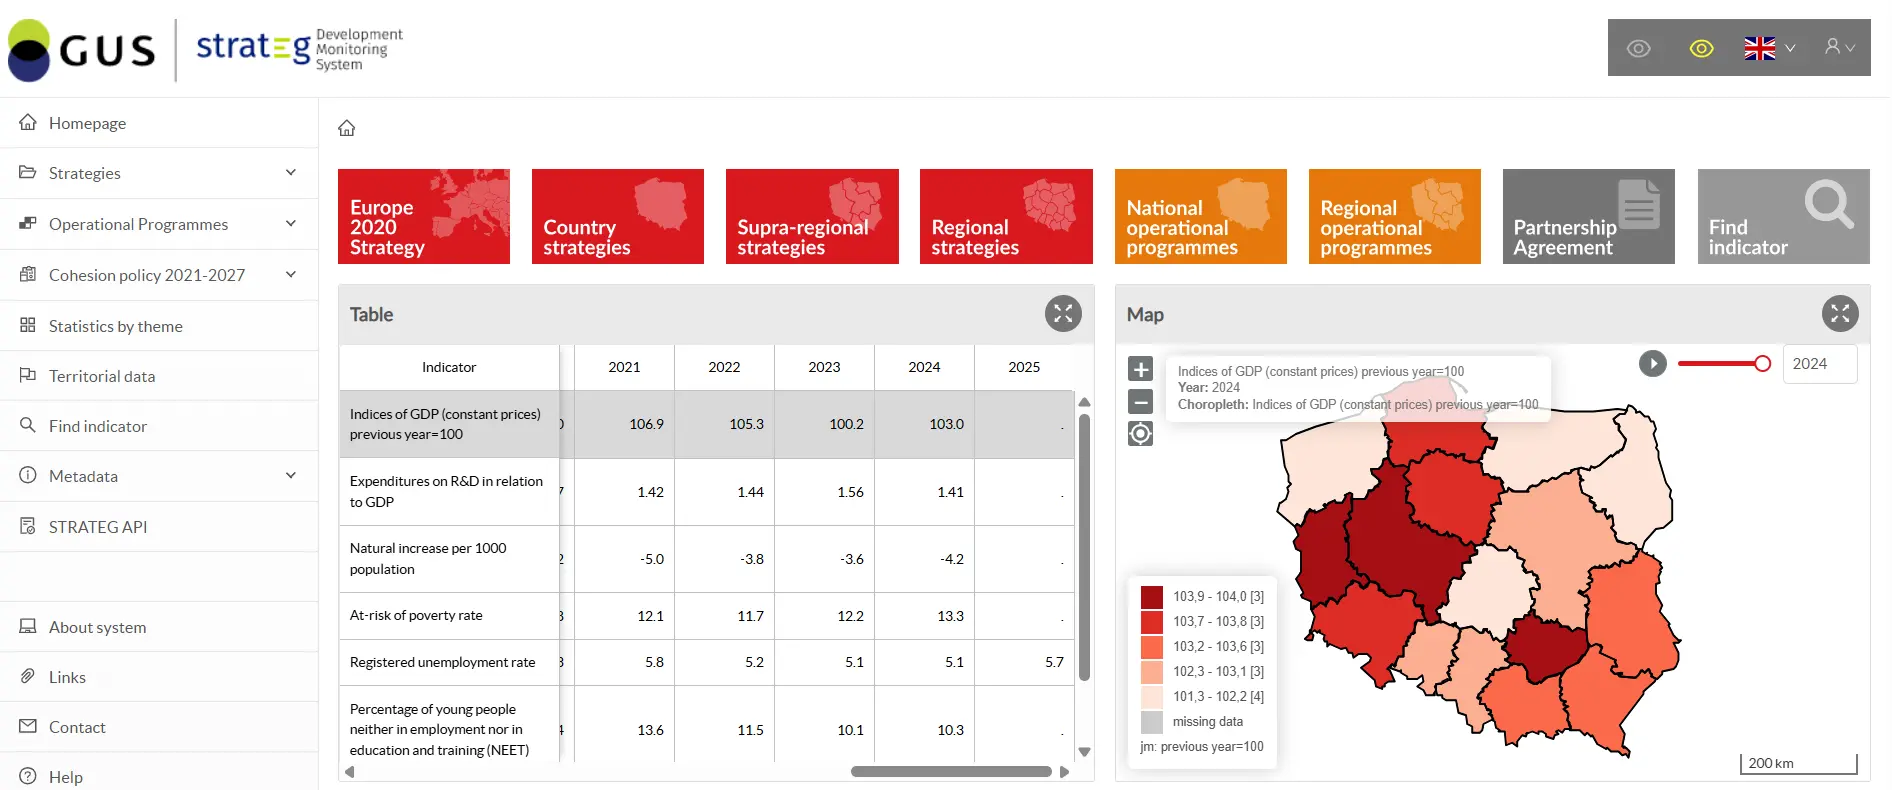
STRATEG

This is a strategic monitoring tool utilising modern solutions, including in the field of data visualisation. The system’s core functionalities include the ability to monitor the progress of a given strategy, present data by local government unit, and carry out comparative analyses of indicators at an international level within the European Union. It is also a rich source of methodological information, statistical publications and brief analytical reports. Users will find here, amongst other things: definitions of indicators, guidance on interpreting data and its potential uses, and basic information on the current situation across key thematic areas.
Training topics:
1. System content and elements of the home page:
- indicators — types and data sources;
- subject and territorial scope of the data;
- metadata — searching for methodological information.
2. Grouping of indicators – presentation of data in the form of predefined (static) tables:
- by strategic documents;
- by cohesion policy objectives;
- by thematic areas;
- by local government units.
3. Ways to search for indicators:
- by name;
- by thematic area;
- advanced search.
4. Data visualisation – relationships between individual elements:
- dynamic table and options for modifying it;
- chart and options for modifying it;
- map and options for modifying it;
- report.
5. Analytical module — contains methodological information on indicators and analyses of trends, both at national level and across different territorial areas.
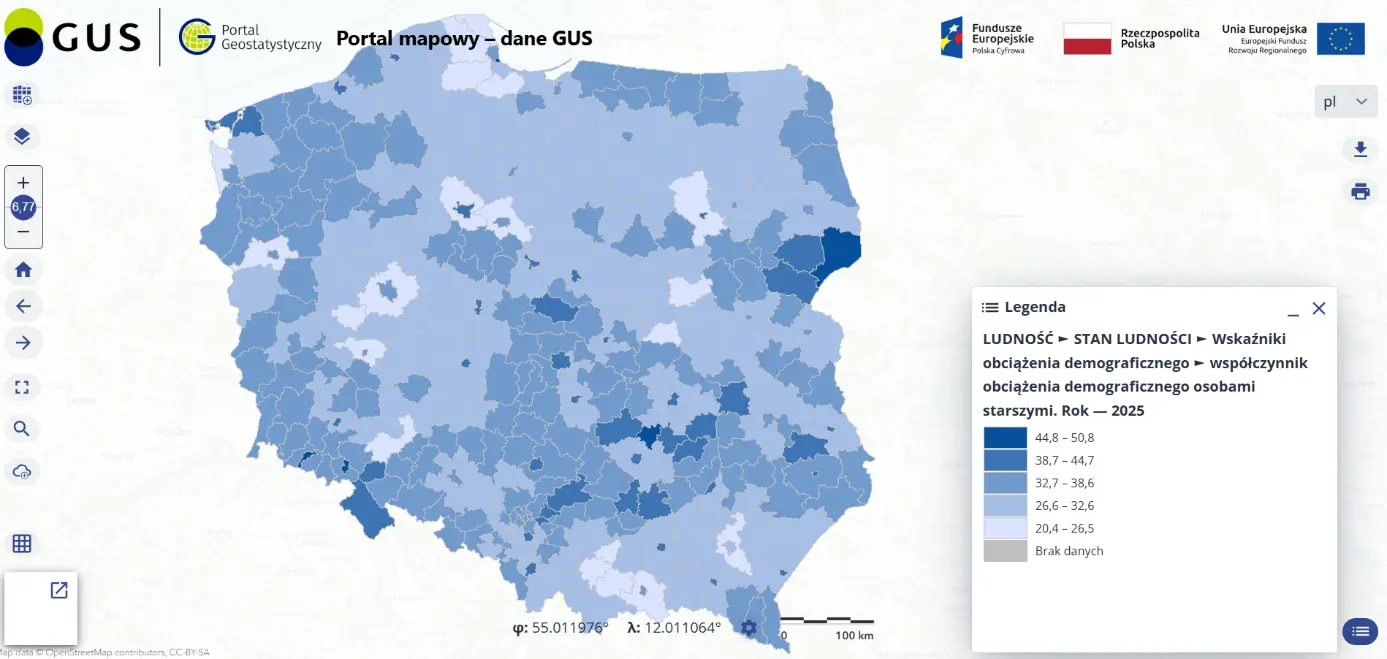
Geostatistical Portal

This is a modern solution used for the cartographic visualisation of statistical data obtained from censuses and the Local Data Bank (BDL). It serves to collect, present and make information available to a wide range of users, including public administration, businesses, individual users and scientific and research institutions.
Training topics:
1. System content and elements of the home page:
- search service (searching for spatial data sets and services based on the content of their corresponding metadata, enabling the display of metadata content);
- the viewing service (displaying, navigating, zooming in and out, panning or overlaying the displayed datasets, and displaying explanations of cartographic symbols and metadata content);
- a download service (statistical units, population distribution), providing data sets in GML and SHP formats;
- metadata (published for existing spatial data sets and services).
2. Data visualisation:
- data selection (data provided by official statistics, e.g. BDL, or own data);
- area selection (analysis for the whole of Poland or, for example, a selected province);
- selection of visualisation method (e.g. cartogram or various types of cartodiagrams);
- selection of method parameters (customising the visualisation to individual needs).
3. Data presentation:
- cartogram (measure, level of aggregation, number of intervals, classification method, colour scale);
- cartodiagram (measure, level of aggregation, symbols, diagram colours).
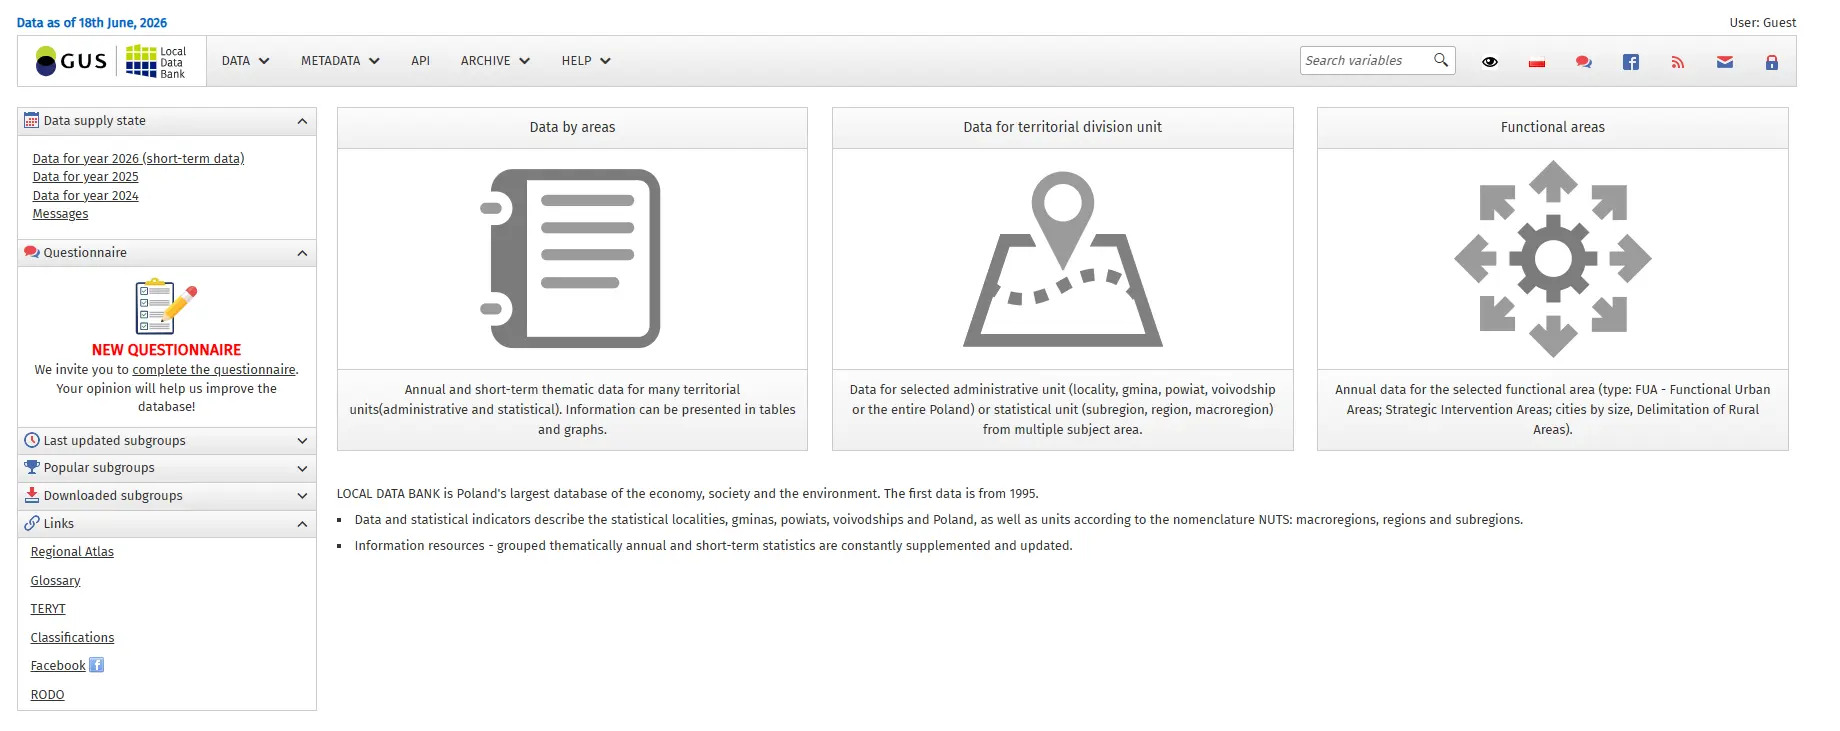
Local Data Bank (BDL)

This is Poland’s largest organised collection of information on the social, economic and demographic situation, as well as the state of the environment. It covers administrative units at various levels of territorial division: the country, provinces, counties, municipalities, statistical localities, as well as regions and sub-regions. It offers annual data from 1995 and quarterly and monthly data from 2005.
Scope of the training:
1. System content and elements of the home page:
- availability and subject scope of the data;
- territorial division (territorial units, NUTS statistical units);
- metadata – searching for methodological information.
2. Data grouping:
- by subject area;
- by territorial units.
3. Data visualisation:
- multidimensional table;
- relational table;
- pivot table.
4. Additional functions:
- explanations and terms (definitions of terms used in the BDL);
- data availability status (planned date of data release).
-
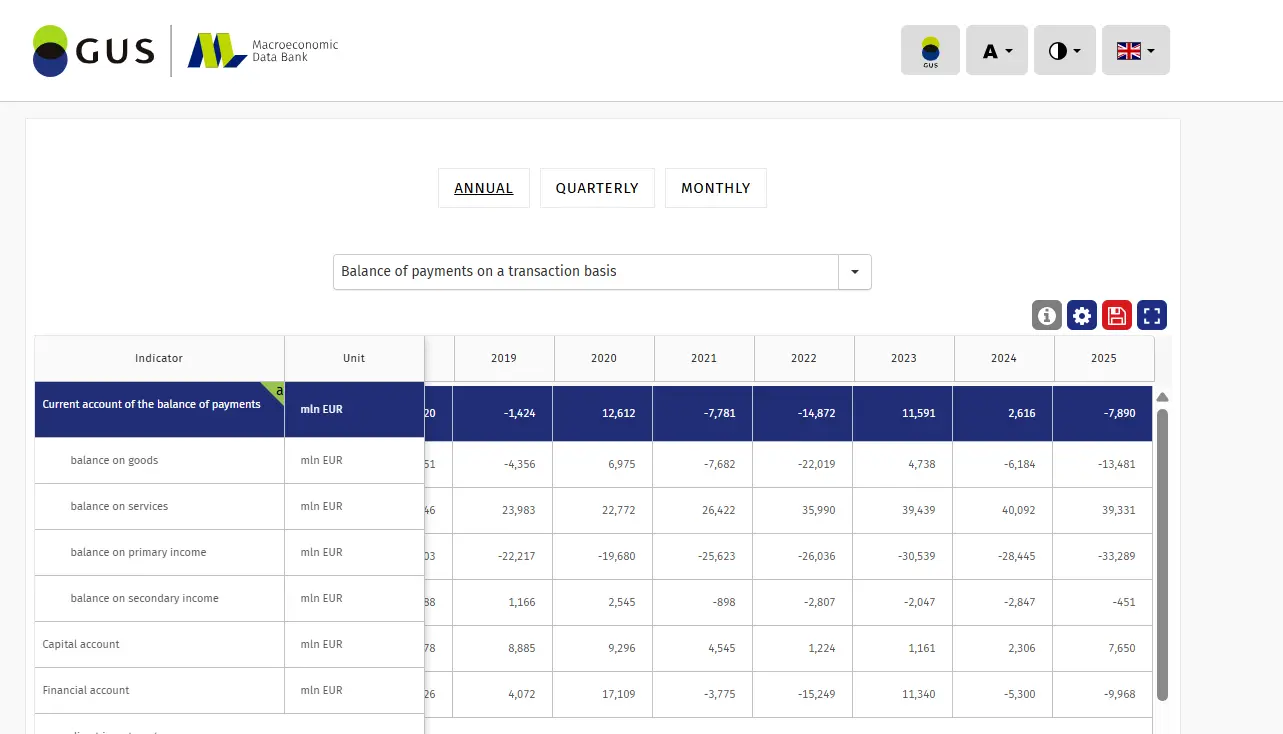
Macroeconomic Data Bank (BDM)

This is a database containing indicators that characterise Poland’s economic and social situation. The database provides access to long time series for key macroeconomic data across various subject areas.
Topics covered in the training:
1. System content and elements of the home page:
- selection of a subject area;
- selection of a time period.
2. Data summaries — by annual, quarterly and monthly reports.
3. Data visualisation — charts (selection of time period, chart type, colour scheme).
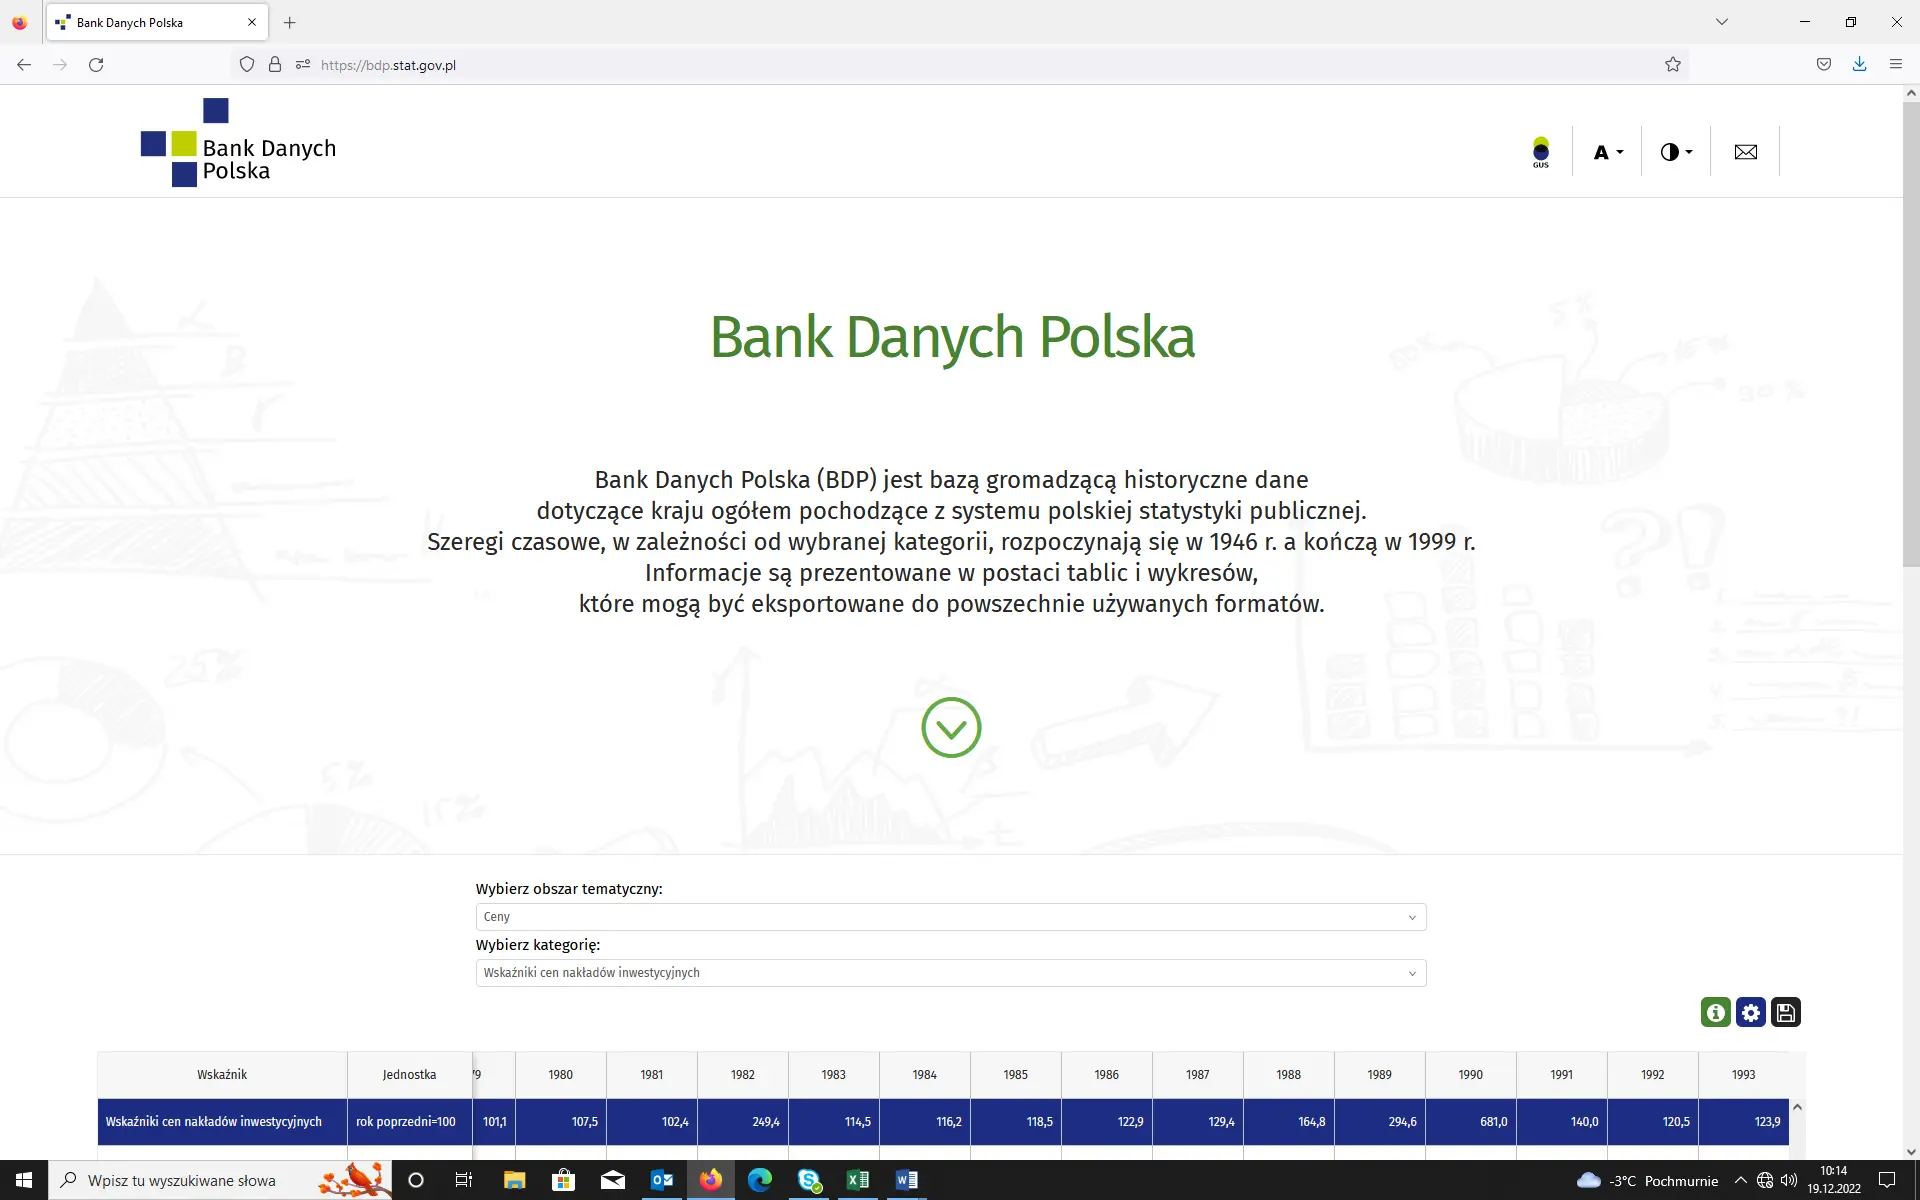
Data Bank Poland
This is a database containing historical data on the country as a whole, sourced from the Polish public statistics system. Depending on the category selected, the time series begin in 1946 and end in 1999. The information is presented in the form of tables and charts, which can be exported to commonly used formats.
Training topics:
1. System content and elements of the home page:
- a. selecting a subject area;
- b. selecting a category.
2. Data summaries – by annual reports.
3. Data visualisation – charts (selecting a time period, chart type and colour).
Knowledge Databases (DBW)

This is a comprehensive platform for statistical data that enables you to carry out analyses. With DBW, you can visualise your data in the form of tables, charts and even maps, download it and use it in your own research. An intuitive division into four areas – the economy, society, the environment and multidisciplinary statistics – quickly guides users to their chosen topic. DBW also offers a wealth of additional information, including links to recommended publications, reports, conferences and interesting facts related to a given field.
Training topics:
- System content and elements of the home page – dashboards for individual fields.
2. Data generation panel:
- searching for an indicator;
- selecting a time and geographical range;
- customising the table layout;
- saving and exporting data.
Demography Database

It was established to provide users with continuous access to statistical information and serves as an integrated source of data on the demographic situation in Poland. It contains data from 2002 onwards, organised according to the territorial division in force in the relevant reporting year.
Training topics:
1. System content and elements of the home page – downloading and generating data reports on:
- population size and structure;
- natural population change (marriages, separations, divorces, births, deaths);
- population migration (emigration, immigration, internal migration);
- population projections;
- life expectancy.
2. Data summaries:
- by geographical breakdown (country, provinces, sub-regions, districts, municipalities);
- by time period (monthly, quarterly, half-yearly, annual).
3. Generation of summaries in the form of tables in a layout specified by the user.
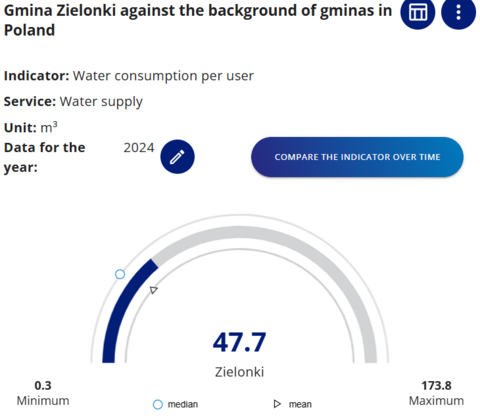
Public Services Monitoring System (SMUP)

The Public Services Monitoring System provides local government bodies (JST), businesses and the public with the information necessary for a comprehensive assessment of services provided at local level. This information is based on public statistics and data collected by the administration from records, registers and dispersed sources. The system includes indicators presented at the service delivery level (e.g. at the local authority level) and aggregated figures at higher levels (e.g. at the provincial level). The long-term objective of developing the PSMS is to optimise the delivery of services for which the public administration is responsible, based on integrated, high-quality data.
In accordance with the provisions of the Operational Programme for Economic Growth (PO WER), the scope of information covered by SMUP includes the following service areas:
1. Education;
2. Local social policy;
3. Culture and recreation;
4. Roads and transport;
5. Environmental protection;
6. Property management;
7. Investments and construction;
8. Surveying and cartography;
9. Local taxes and charges;
10. Local government finances.
Training topics:
1. Basic interface:
- information on monitored service areas, services and indicators within a service;
- clock chart and chart tab elements;
- comparison chart tab – available options;
- ‘basic information’ tab and information on the indicator and service.
2. Advanced analyses:
- selection of: local government unit, service/indicator and time series;
- dimensions of the indicator/service (quantitative, qualitative, availability and efficiency indicators);
- options for logged-in users;
- comparison groups;
- features of the ‘table’ tab;
- Chart’ tab features;
- Map’ tab features;
- Report’ tab features.